European GHG Inventory
July 2024, Origins.earth developed a technology to automate the calculation of territorial emissions on a European scale using the same methodology: the European GHG inventory.
GHG data for each country, calculated using the same methodology
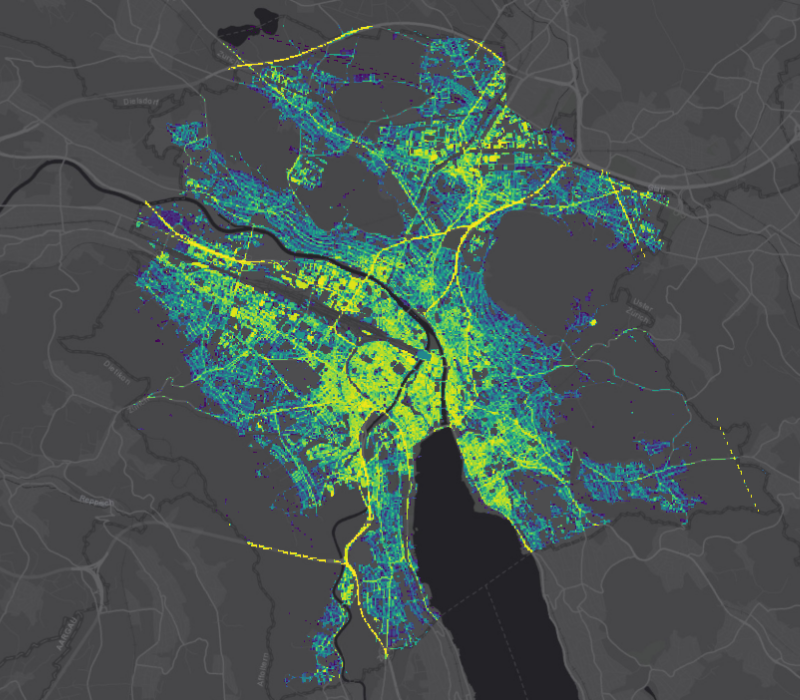
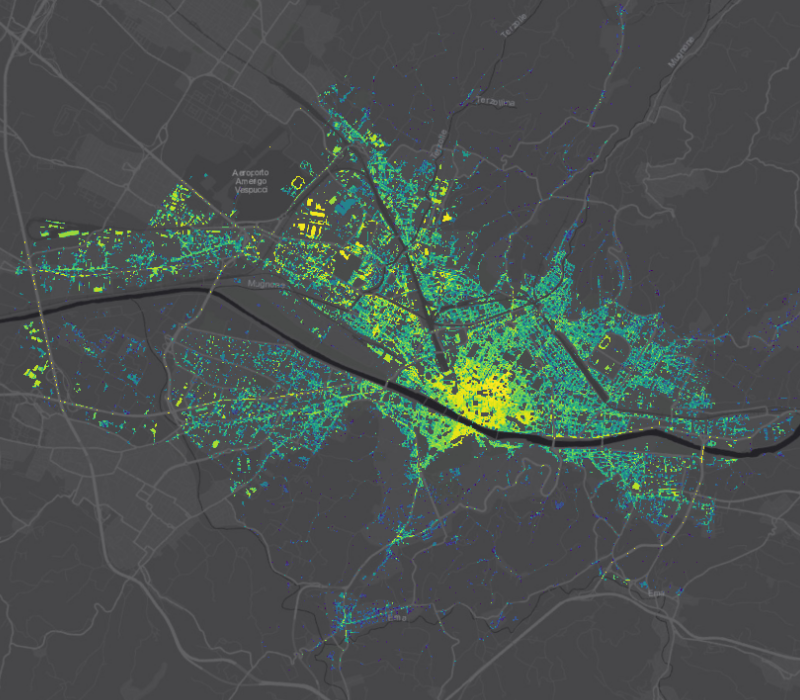
The European Inventory is an automated GHG inventory that was developed with two levels of spatial precisions: a global model (about 5km x 5km) & a high-precision model (10m x 10m)
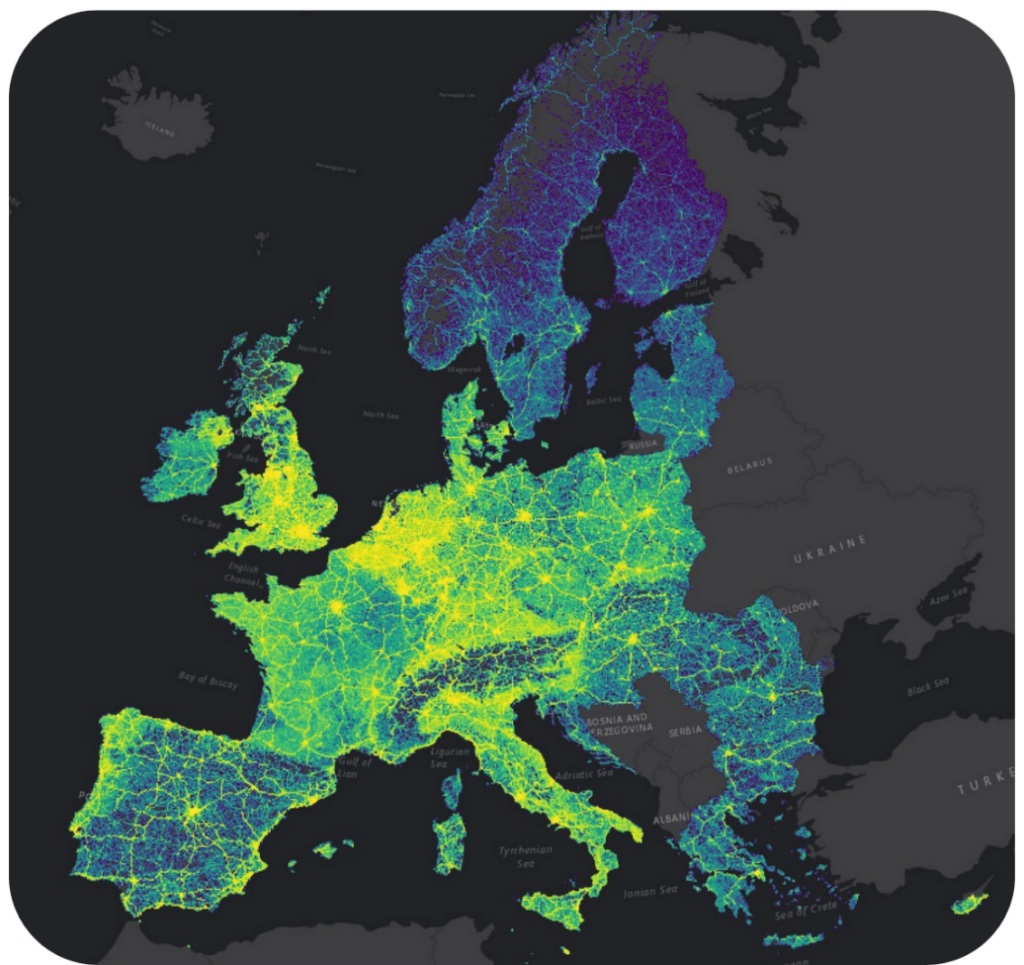
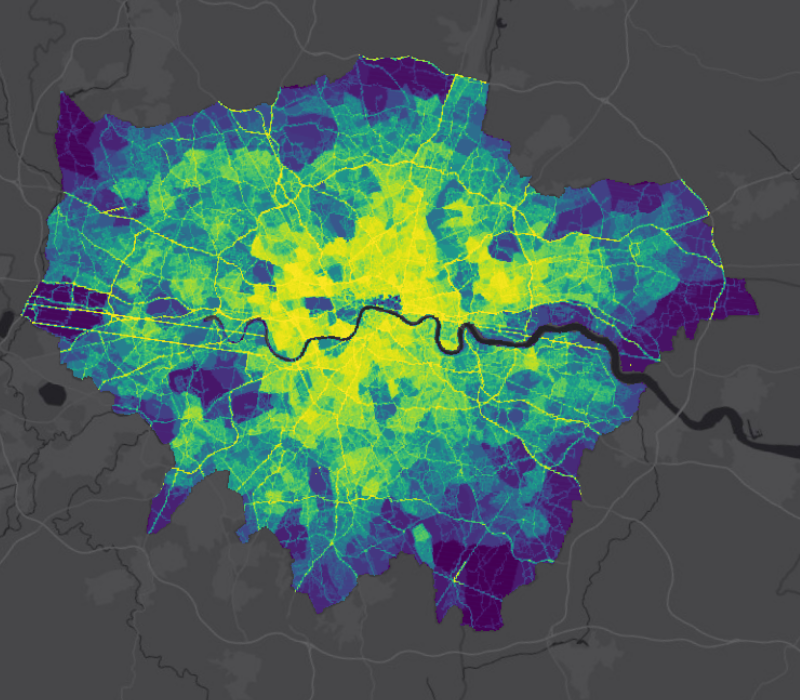
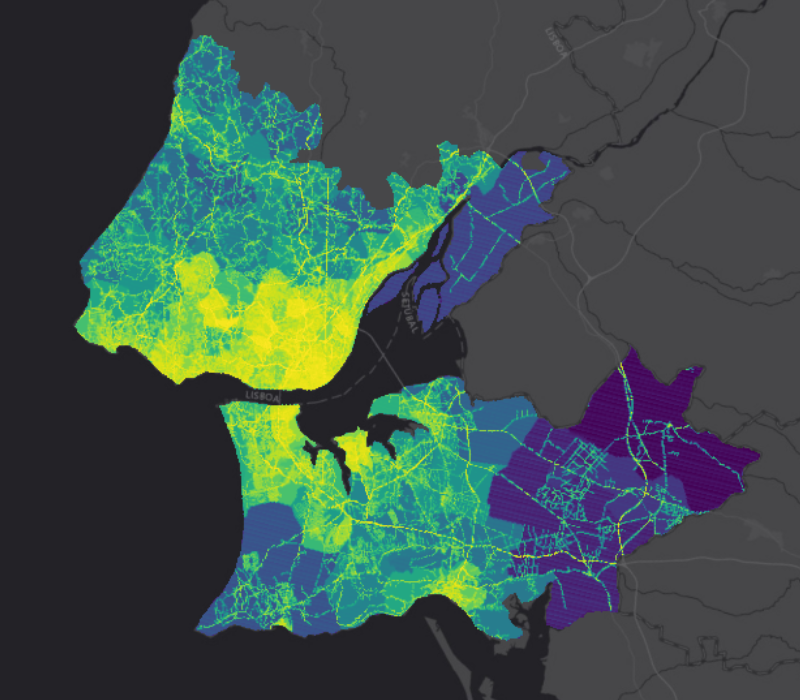
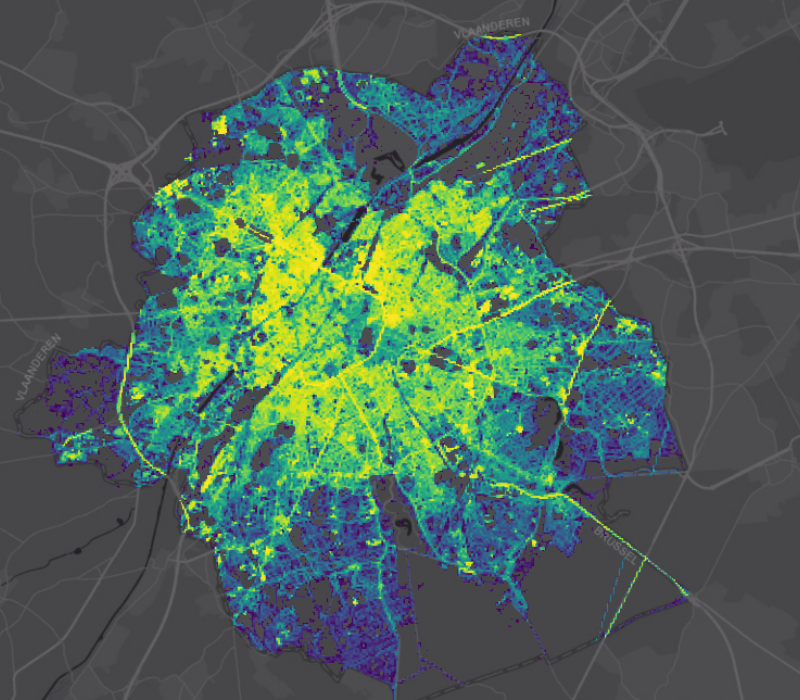
Know the emissions of a European city as well as those of a neighborhood.
High-resolution model: A model that allows a “zoom” on cities and considers more variables (such as buildings distribution and a better modelling of the road traffic) to provide a high-resolution inventory.
Interested in accessing your data?
Contact (EN)
What is the precision of our data ?
Our carbon inventory is spatialized at a 100m x 100m resolution over the entire French territory. It is also made dynamic to estimate hour-by-hour changes in emissions.
This makes it possible to model the amount of greenhouse gases emitted into the atmosphere every hour, at every point in the territory covered.
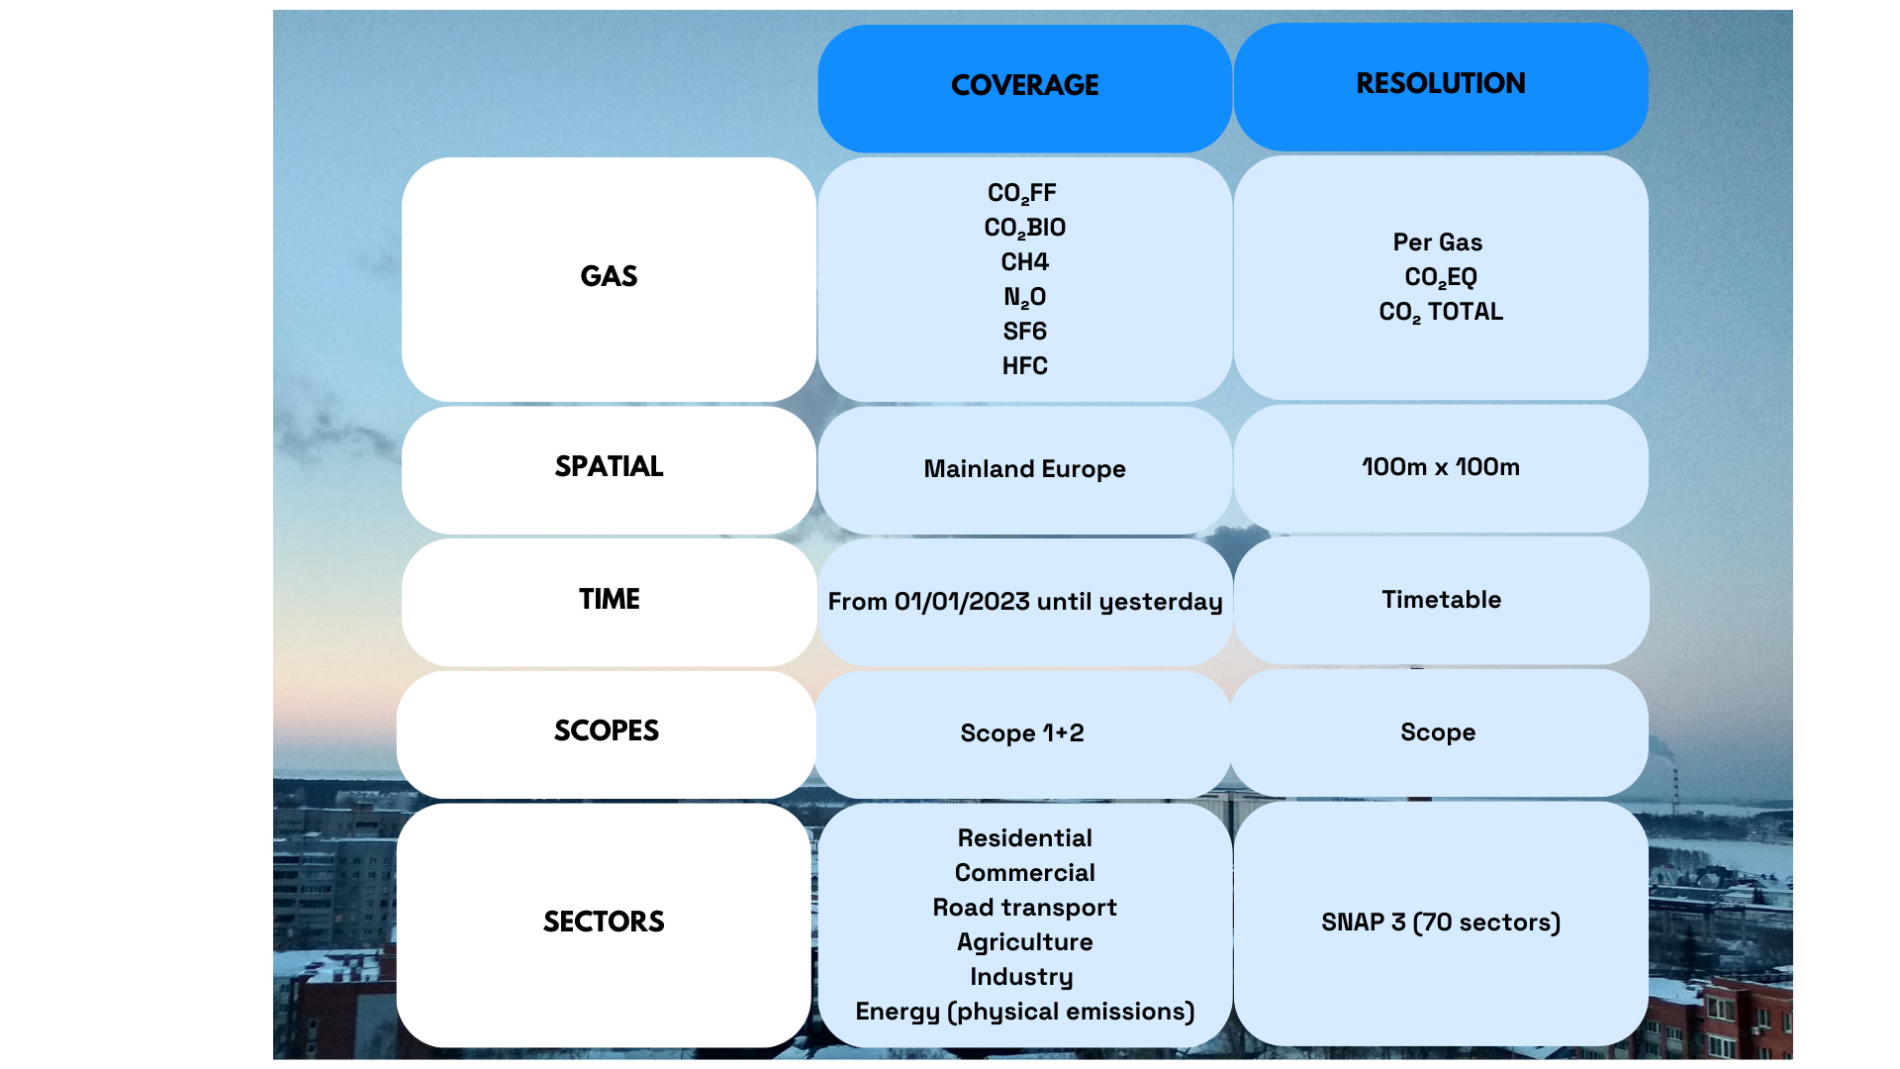
Are described in our french inventories :
Our priority is to guarantee the validity of our data.
Processing and database
80 open-data databases describing area activities
The inventory data is produced by an automated processing chain taking data from more than 80 open-data databases describing the activities of the territory.
It is possible to implement any complementary data source in the technological chain.
Using open-data to describe local activities and their impact on climate
For emissions inventory only open source and public data has been used. By integrating open data from over 15 individual sources across Europe and utilizing more than 30 datasets, Origins has developed a uniform data structure for all European cities, designed to be flexible and enable easy integration of local data into the calculation chain, such as for cities collaborating with Origins.earth. For instance, cities can input specific data such as building energy consumption, main energy sources, road traffic counts, details of specific car fleets, etc
Any questions ?
Check out our Q&As for quick and accurate answers about our services, technology and much more.